Reverse Allocation

Post Reply
User avatar
Steve Rowe
Site Admin
Posts: 2417
Joined: Wed May 14, 2008 4:25 pm
OLAP Product: TM1
Version: TM1 v6,v7,v8,v9,v10,v11+PAW
Excel Version: Nearly all of them

Reverse Allocation

Post by Steve Rowe »

Hello forum,

I've an allocation problem which at first glance ought to be easy to solve but has me stumped.

A standard allocation is easy, the largest item gets the most of the cost and so on.

A= Amount you want to allocate.
B= Amount of the allocation driver that is on the cost centre.
C= Total of the allocation driver that is on all cost centres.

D= A * (B/C)

What I want to do is allocate so that the smallest B gets the largest amount, i.e. column E (or close) in the table below.
alloc.gif
alloc.gif (3.91 KiB) Viewed 9008 times
I've tried a few ways involving reciprocals that kind of do it, but give a curve if I graph the allocation, this isn't right since each unit of the driver ought to have the same weight.

I (probably) could also do it with a TI by calculating D, ranking the result (a non-trivial exercise) and then applying the result to the "opposite" ranked item.

I'm really looking for a mathmatical method that I can use in rules but can't seem to figure one out, not sure if I'm missing something obvious...

Anyone done this before or have any ideas?

Cheers,
Technical Director
www.infocat.co.uk
Duncan P
MVP
Posts: 600
Joined: Wed Aug 17, 2011 1:19 pm
OLAP Product: TM1
Version: 9.5.2 10.1 10.2
Excel Version: 2003 2007
Location: York, UK

Re: Reverse Allocation

Post by Duncan P »

What you have there is ( ( ( A + sum( Driver ) ) / Count ) - Driver . Is that what you want? If A = sum(Driver) then this simplifies to ( A / count ) - Driver.

Watch out though as if you use this for :-

100
200
200
700

you get

500
400
400
-100

If you can cope with negative results then that's fine but if it's e.g. physical stock that's not so good.
User avatar
Steve Rowe
Site Admin
Posts: 2417
Joined: Wed May 14, 2008 4:25 pm
OLAP Product: TM1
Version: TM1 v6,v7,v8,v9,v10,v11+PAW
Excel Version: Nearly all of them

Re: Reverse Allocation

Post by Steve Rowe »

Thanks Duncan, This does give a straight line but isn't I think the opposite of a standard allocation.

Possibly I've applied your logic wrong but if I graph the result I don't get what I was expecting (grren line)
alloc chart.png
alloc chart.png (10.17 KiB) Viewed 9006 times
(I've added a GIF for the table in the first post, I hadn't noticed the format had been lost on posting.)
Technical Director
www.infocat.co.uk
Duncan P
MVP
Posts: 600
Joined: Wed Aug 17, 2011 1:19 pm
OLAP Product: TM1
Version: 9.5.2 10.1 10.2
Excel Version: 2003 2007
Location: York, UK

Re: Reverse Allocation

Post by Duncan P »

OK Steve. I misread your original. Now with the formatted table it is much clearer.

Could you fill in what you would expect for the following, as your example is a bit too regular for me?

Code: Select all

A = 1500

B - Driver    D      E
       1    100      ?
       2    200      ?
       5    500      ?
       7    700      ?
Total 15   1500   1500
If what you want is

Code: Select all

A = 1500

B - Driver    D      E
       1    100    700
       2    200    500
       5    500    200
       7    700    100
Total 15   1500   1500
then I don't think I can help. Ranking in rules is very hard and wasteful.

It might also help to know what the business problem is.

[EDIT]
You might like to look at creating a new driver. You could do this in a number of ways.

The easiest is

Code: Select all

new_driver = 2 * mean( driver ) - driver
Another is

Code: Select all

new_driver = min( driver ) + max( driver ) -  driver
[/EDIT]

Cheers,
Duncan.
User avatar
garry cook
Community Contributor
Posts: 209
Joined: Thu May 22, 2008 7:45 am
OLAP Product: TM1
Version: Various
Excel Version: Various

Re: Reverse Allocation

Post by garry cook »

I've had to do this before and it was a bit of a nightmare. I managed to use the following logic. It's not perfect but it was close enough for the project I was working on and saved a lot of extra complexity / processing power to implement.

May not be accurate enough for your requirements but might give the basic shape you're looking for.
Attachments
Example.xlsx
(11.02 KiB) Downloaded 255 times
Duncan P
MVP
Posts: 600
Joined: Wed Aug 17, 2011 1:19 pm
OLAP Product: TM1
Version: 9.5.2 10.1 10.2
Excel Version: 2003 2007
Location: York, UK

Re: Reverse Allocation

Post by Duncan P »

The problem appears to be to choose a way of generating a new driver that has an ordering that is the reverse of the ordering of the original driver.

Garry's example shows another way of doing this using the reciprocal of the normalised driver. The key question is which way is appropriate for the actual allocation being done.

For both Garry's and Steve's situations it would be really helpful to know what was being allocated, and across what, and what the driver was.
whitej_d
Community Contributor
Posts: 103
Joined: Mon Sep 05, 2011 11:04 pm
OLAP Product: TM1
Version: 10.2
Excel Version: 2010

Re: Reverse Allocation

Post by whitej_d »

I think this will work for your example, but it's a lot of steps and I would imagine could be quite heavy if you're doing a large allocation to many members. Some of the steps could be combined though to give less component elements of the calculation. This also needs a dummy dimension to do the max/min tests and logic which may also have implications with large dimensions. The Max/Min tests could be pulled out to a separate 3 dimensioned cube though.

In this example:

Cube - 'Rev Alloc'

Dim 1 - 'PC'
--Total
--- PC1
--- PC2
--- PC3
--- PC4
--- PC5

Dim 2 - 'PC Clone'
--Total
--- PC1
--- PC2
--- PC3
--- PC4
--- PC5
-- nInput

Dim 3 - Rev Alloc
-- A
-- B
-- C
-- D
-- E
-- F
-- G
-- Max + Min
-- Final

Code: Select all

['nInput', 'A'] = N: 1000;

['nInput', 'C'] = N: ['A'] * (['B'] \ ['B','PC':'Total']);

['D', 'nInput'] = N: 0;

## Use Clone PC dimension to test if minimum. PC is minimum if the Total of the Clone PCs is equal to the nInput value of 'C'

['D'] = N: 
   IF(DB('Rev Alloc', 'nInput',!PC,'C') >= DB('Rev Alloc', 'nInput',!PC Clone,'C'), 
     DB('Rev Alloc', 'nInput',!PC,'C'), 
# else
     0
   );

# E is result of minimum test. Can query Total consolidation of PC to find minimum 

['nInput', 'E'] = N: 
  IF(['nInput', 'C'] = ['PC Clone':'Total', 'D'],
    ['nInput', 'C'],
# else
    0
  );

## F Performs test for maximum value. Slightly different logic. 
# PC Clone is populated only if PC is less than PC Clone test. Maximum is therefore the only PC which has no values.
 

['F'] = N:
   IF(DB('Rev Alloc', 'nInput',!PC,'C') < DB('Rev Alloc', 'nInput',!PC Clone,'C'), 
      DB('Rev Alloc', 'nInput',!PC,'C'), 
# else
    0
   );

## G is result of maximum test

['G'] = N: 
  IF(['nInput', 'C'] <> 0 & ['PC Clone':'Total', 'F'] = 0, 
    ['nInput', 'C'],
# else
    0
  );

['nInput','Max + Min'] = N: ['nInput', 'PC':'Total', 'E'] + ['nInput', 'PC':'Total', 'G'];

# Once we have the total of the maximum + minimum, the result is Max + Min - original allocated value

['nInput', 'Final'] = N: ['nInput','Max + Min'] - ['C'];
See the attached cubes/dims/rux files for (hopefully) working example.
Attachments
Rev Alloc.zip
(1.83 KiB) Downloaded 216 times
whitej_d
Community Contributor
Posts: 103
Joined: Mon Sep 05, 2011 11:04 pm
OLAP Product: TM1
Version: 10.2
Excel Version: 2010

Re: Reverse Allocation

Post by whitej_d »

Hmm,

Actually my solution doesn't fully work as it fails when there are an odd number of elements for the allocation unless the middle value is half way between the min and max. :?

Back to the drawing board!
rozef
Posts: 74
Joined: Thu Jun 17, 2010 10:35 am
OLAP Product: TM1
Version: 9.4 9.5.1
Excel Version: 2003 - 2007

Re: Reverse Allocation

Post by rozef »

Hi,

to get an order with rule I see no other solution then to hardcode all amount elements:
('Indics' is the number of amount dimension).

Code: Select all

['Rank']=N: 
IF( ['B'] = 0 , 0 , 1 
+ IF( ['B','1'] > ['B'] % !Indics @= '1' , 0 , 1 )
+ IF( ['B','2'] > ['B'] % !Indics @= '2' , 0 , 1 )
+ IF( ['B','3'] > ['B'] % !Indics @= '3' , 0 , 1 )
+ IF( ['B','4'] > ['B'] % !Indics @= '4' , 0 , 1 )
+ IF( ['B','5'] > ['B'] % !Indics @= '5' , 0 , 1 )
);
Then you can make a reverse order and get the associate value, again passing all elements in rule:

Code: Select all

['E']=N: 
DB( 'MyCube' , 'D', 
IF( ['Rank','1'] = ConsolidatedCountUnique( 2 , 'Indics' , '', 'B', 'Total' ) + 1 - DB( 'MyCube' , 'Rank' , !Indics ) , '1' ,
IF( ['Rank','2'] = ConsolidatedCountUnique( 2 , 'Indics' , '', 'B', 'Total' ) + 1 - DB( 'MyCube' , 'Rank' , !Indics ) , '2' ,
IF( ['Rank','3'] = ConsolidatedCountUnique( 2 , 'Indics' , '', 'B', 'Total' ) + 1 - DB( 'MyCube' , 'Rank' , !Indics ) , '3' ,
IF( ['Rank','4'] = ConsolidatedCountUnique( 2 , 'Indics' , '', 'B', 'Total' ) + 1 - DB( 'MyCube' , 'Rank' , !Indics ) , '4' ,
IF( ['Rank','5'] = ConsolidatedCountUnique( 2 , 'Indics' , '', 'B', 'Total' ) + 1 - DB( 'MyCube' , 'Rank' , !Indics ) , '5' ,
continue ))))));
This mean you must have a fix number of amounts and a good code generator.
I don't know the performances with ConsolidatedCountUnique function but you can easely find a way to bypass it.

I am pretty sure there is no "generic" solution or a perfect mathematic combination due to the the lake of iteration in TM1 rules.
This is the best I can offer you.

Cheers,
whitej_d
Community Contributor
Posts: 103
Joined: Mon Sep 05, 2011 11:04 pm
OLAP Product: TM1
Version: 10.2
Excel Version: 2010

Re: Reverse Allocation

Post by whitej_d »

Right,

I think I have a solution which works now.

It uses the dummy dimension to perform the ranking by repeating the value the number of times equal to the ranking. Then a ranking can be built on the fly by dividing the total of the ranking column by the original allocated value.

The ranking is then assigned as an alias to the elements and is used to return the reverse ordering of the values.

It works in every case, EXCEPT if 2 drivers are identical as the alias fails. It should be possible to get round this using the dummy dimension in the cube to apply a mask based on the ranking logic, but then how should it work logically if this were the case anyhow?

If the first 2 drivers are the same, does column E show the last 2 allocated values the same?


Code: Select all


['nInput', 'A'] = N: 1000;

['nInput', 'C'] = N: ['A'] * (['B'] \ ['B','PC':'Total']);

['nInput', 'Ranking'] = N: ['PC Clone':'Total', 'D'] \ ['nInput','C'];

['D', 'nInput'] = N: 0;


['D'] = N: 
   IF(DB('Rev Alloc', 'nInput',!PC,'C') >= DB('Rev Alloc', 'nInput',!PC Clone,'C'), 
     DB('Rev Alloc', 'nInput',!PC,'C'), 
# else
     0
   );

# Use Ranking alias to look up reverse ranking amount

['nInput', 'Final'] = N: 

DB('Rev Alloc','nInput',
STR(ElcompN('PC', 'Total') - ['Ranking'] + 1, 3, 0),'C');

Attachments
Rev Alloc.zip
(2.35 KiB) Downloaded 225 times
whitej_d
Community Contributor
Posts: 103
Joined: Mon Sep 05, 2011 11:04 pm
OLAP Product: TM1
Version: 10.2
Excel Version: 2010

Re: Reverse Allocation

Post by whitej_d »

Actually if you need to cope with duplicate driver values and still apply the reverse allocation, you can add a very small random number on the the driver and calculate the ranking based on this unique value.


reverse allocation.gif
reverse allocation.gif (42.76 KiB) Viewed 8945 times
Duncan P
MVP
Posts: 600
Joined: Wed Aug 17, 2011 1:19 pm
OLAP Product: TM1
Version: 9.5.2 10.1 10.2
Excel Version: 2003 2007
Location: York, UK

Re: Reverse Allocation

Post by Duncan P »

I would be quite careful in using random numbers in TM1 rules and TI as RAND can only return 65536 distinct numbers before it starts repeating itself.

Probably not an issue in this case but something to be aware of.
whitej_d
Community Contributor
Posts: 103
Joined: Mon Sep 05, 2011 11:04 pm
OLAP Product: TM1
Version: 10.2
Excel Version: 2010

Re: Reverse Allocation

Post by whitej_d »

Fair point!

You could instead use the (dimix('PC', !PC)/ 100000000000) to make it truly unique.
User avatar
ioscat
Regular Participant
Posts: 209
Joined: Tue Jul 10, 2012 8:26 am
OLAP Product: Contributor
Version: 9.5.2 10.1.1 10.2
Excel Version: 07+10+13
Contact:

Re: Reverse Allocation

Post by ioscat »

one more illustration
Attachments
Безымянный.png
Безымянный.png (6.62 KiB) Viewed 8929 times
User avatar
Steve Rowe
Site Admin
Posts: 2417
Joined: Wed May 14, 2008 4:25 pm
OLAP Product: TM1
Version: TM1 v6,v7,v8,v9,v10,v11+PAW
Excel Version: Nearly all of them

Re: Reverse Allocation

Post by Steve Rowe »

Hi,

Many thanks to all for your efforts, I'm beginning to think that the problem is impossible but I'm struggling to understand why....

whitej_d especially thanks for building a working model based on ranking however thinking about it further however I don't think a rank based approach will work since it assumes an even spacing of the initial values that are driving the allocation. Irrespective of the practical aspect of doing the work on many thousands of data points any solution should result in each point of driver attracting the same value of the amount to be allocated.

ioscat, I think your logic fails for the same reason, each point of the driver number does not attract the same amount of the cost.

Garry, thanks for your suggestion, I'd already been down the reciprocal route but again the average cost of each point of the driver is not the same using this method.

I have fiddled around a bit more and plotting the trend line of the standard chart with it's formula gave me a clue on how to do this. It is still by no means straight forward (in TM1) but I think gives the right answer.

If I calculate the average point cost against the whole range I get the following (using the same example)
AvPtCnt=1000/150=6.67

I then need the max and min of the driver number (the hard bit in TM1) and multiple this by the AvPtCnt
MaxPts=50*6.67=333.33
MinPts=10*6.67=66.67

Adding them together gives me 400

My reverse allocation formula is then

RevAlloc = -AvPtCnt*Driver +MaxPts+MinPts

Putting this into Excel gives me the same shaped graph.
g1.gif
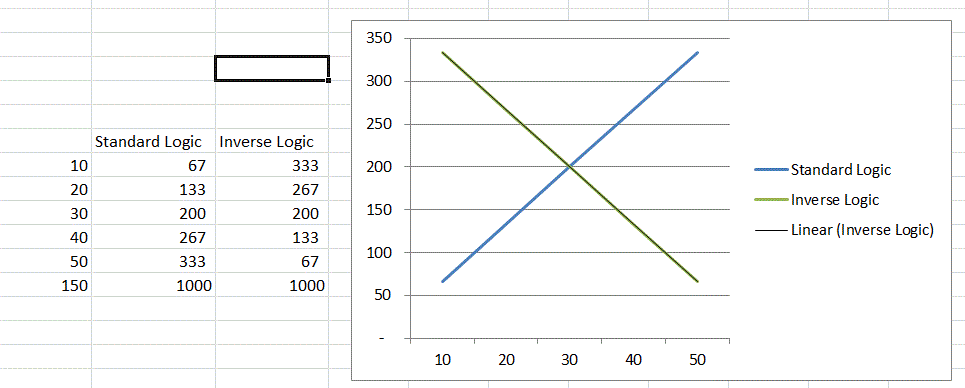
g1.gif (17.2 KiB) Viewed 8910 times
This appears to hold for the general case too.
g2.gif
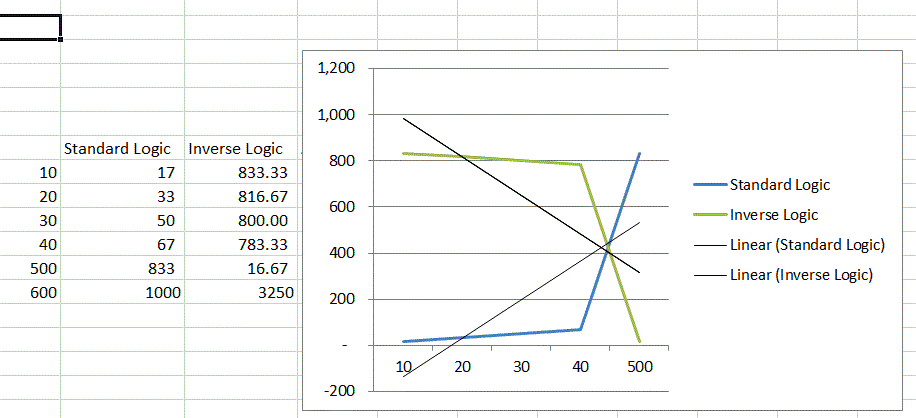
g2.gif (20.76 KiB) Viewed 8910 times
So this seems OK to do I only need to do "rank" the highest and lowest values of the set of driver values which I think I would probably do in a single pass through them with a TI job, not ideal but hey ho...

To me this seems like as close as I am going to get to a perfect solution anyone have a better idea?

The actual business problem is as follows.

A bunch of individuals under take a series of jobs, depending on certain properties of these jobs (time of day, day of week, the customer account the job is undertaken for) each job gets a certain number of points. These points control how much the individual is paid for the job which decreases the profitability of the job for the business so when we calculate the profitability of the customer account we need to do a reverse allocation.

Cheers and thanks to all for the efforts, hope y'all enjoyed thinking about it....

Cheers,

Edit :
Excel sheet with sample model
alloc.xlsx
(12.48 KiB) Downloaded 245 times
Also when I talk about the average point count being the same this doesn't really hold for the reverse allocation, I think what I mean is that the graph needs to be linear, anyway hope you get the idea.
Technical Director
www.infocat.co.uk
User avatar
Steve Rowe
Site Admin
Posts: 2417
Joined: Wed May 14, 2008 4:25 pm
OLAP Product: TM1
Version: TM1 v6,v7,v8,v9,v10,v11+PAW
Excel Version: Nearly all of them

Re: Reverse Allocation

Post by Steve Rowe »

Hmmm, Should have checked out Duncans piece about creating a new driver too as this works as well

new_driver = 2 * mean( driver ) - driver

new_driver = min( driver ) + max( driver ) - driver
I suspect his option 2 is the broadly the same as my solution and involves the same level of effort since I need to know the min and max of the driver value.
option 1 also works I'll need to think about if it is a more efficent method.

Cheers,
Technical Director
www.infocat.co.uk
Post Reply